Petoro - a driving force on the Norwegian continental shelf

SDFI and Petoro annual report 2013
Foto: Emile Ashley

Key figures 2013

Net income for the portfolio in 2013 came to NOK 132.8 billion, compared with NOK 150 billion the year before. Total operating revenue was NOK 194.3 billion, compared with NOK 213.9 billion in 2012. This yielded a cash flow to the government of NOK 124.8 billion as against NOK 146.9 billion the year before. Total production averaged 1 034 000 barrels of oil equivalent per day (boe/d), which was nine per cent lower than the 2012 figure of 1 132 000 boe/d.

FINANCIAL DATA (in NOK million)


2013

2012

2011

2010

2009

Operating revenue

194 308

213 885

188 820

159 270

154 186

Operating income

132 455

152 717

134 959

107 225

103 964

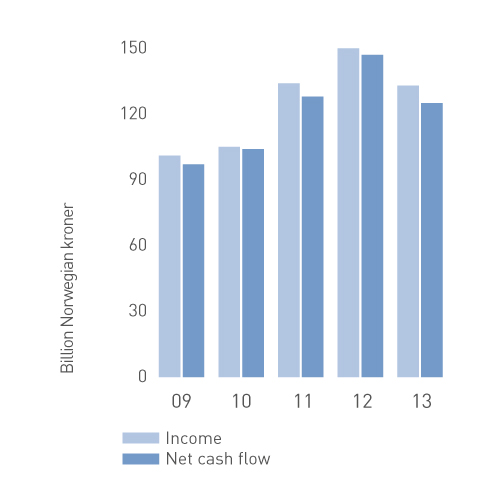
Net income for the year

132 817

149 986

133 721

105 379

100 662

Cash flow from operating activities

157 882

174 499

149 205

123 210

120 050

Cash flow applied to investment activities

33 585

25 610

21 437

18 443

23 592

Net cash flow

124 825

146 930

128 083

103 572

96 992


OPERATIONAL DATA


2013

2012

2011

2010

2009

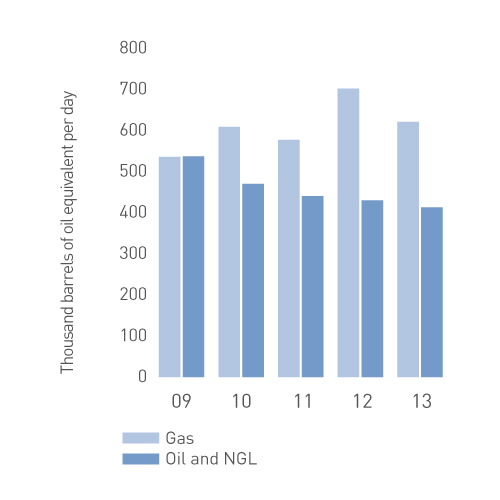
Production oil, NGL and condensate (1 000 barrels per day)

413

430

440

470

537

Production dry gas (million scm per day)

99

112

92

97

85

Oil, NGL and dry gas production (1 000 boe per day)

1 034

1 132

1 016

1 080

1 074

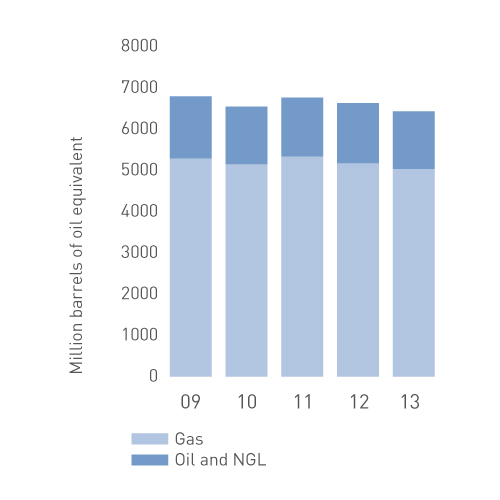
Remaining reserves (million boe)

6 423

6 623

6 759

6 541

6 789

Reserve replacement rate (three-year average in per cent)

90

86

49

1

(3)

Reserves added (million boe)

177

278

601

187

(176)

Oil price (USD per barrel)

110.36

113.27

114.00

79.38

60.53

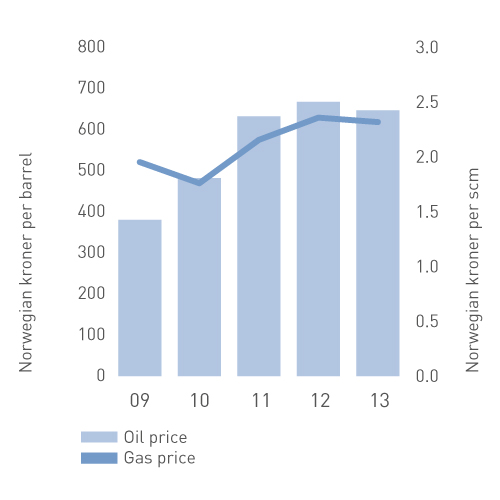
Oil price (NOK per barrel)

647

657

632

482

380

Gas price (NOK per scm)

2.31

2.35

2.15

1.76

1.95

PRODUCTION

Production
Total production from the SDFI portfolio was nine per cent lower than in 2012. The output of liquids (oil, NGL and condensate) declined by four per cent compared with the year before, while gas production was down by 12 per cent.

INCOME AND CASH FLOW

Income and cash flow
Net income for 2013 was NOK 133 billion, down by 11 per cent from the year before. This reflected declines of 13 per cent in gas sales and two per cent in gas prices compared with the 2012 record. Overall oil and gas sales averaged 1 094 000 boe/d, compared with 1 197 000 boe/d in 2012. Cash flow, transferred in its entirety to the government, was NOK 125 billion, down by almost NOK 22 billion from the year before.

OIL AND GAS PRICES

Oil and gas prices
The price of oil from the SDFI portfolio averaged NOK 647 per barrel in 2013, compared with NOK 657 the year before. In US dollars, the average was USD 110 per barrel – down by about USD 3 from 2012. Gas fetched an average price of NOK 2.31 per scm in 2012, two per cent lower than the year before.

REMAINING RESERVES

Remaining reserves
The portfolio’s estimated remaining reserves totalled 6 423 million boe at 31 December, down 200 million boe from the year before. Production in 2013 came to 377 million boe, but was partly offset by the decision to deposit carbon dioxide in Snøhvit, the improved recovery project on Åsgard and the Delta 2 fast-track project on Oseberg.

EXPENSES

Expenses
Total operating expenses were roughly on a par with 2012. The cost of operating fields, pipelines and land-based plants was up by 11 per cent from the year before. This rise reflected increased environmental taxes and reclassification of tax expense for gas operations related to Statoil Natural Gas LLC (SNG). The increase was offset by the lower cost of gas for onward sale.

SAFETY

Safety
Petoro’s main parameter for monitoring HSE developments in the SDFI portfolio is the serious incident frequency (SIF), which measures the number of such events per million working hours. This figure for 2013 was 0.9, an improvement on the year before. The number of personal injuries per million working hours came to 4.4, an improvement of almost 20 per cent.